● Le Monde Énergie
📅 28/03/2026 à 05:57
La carte des prix des carburants dans toutes les stations-service de France
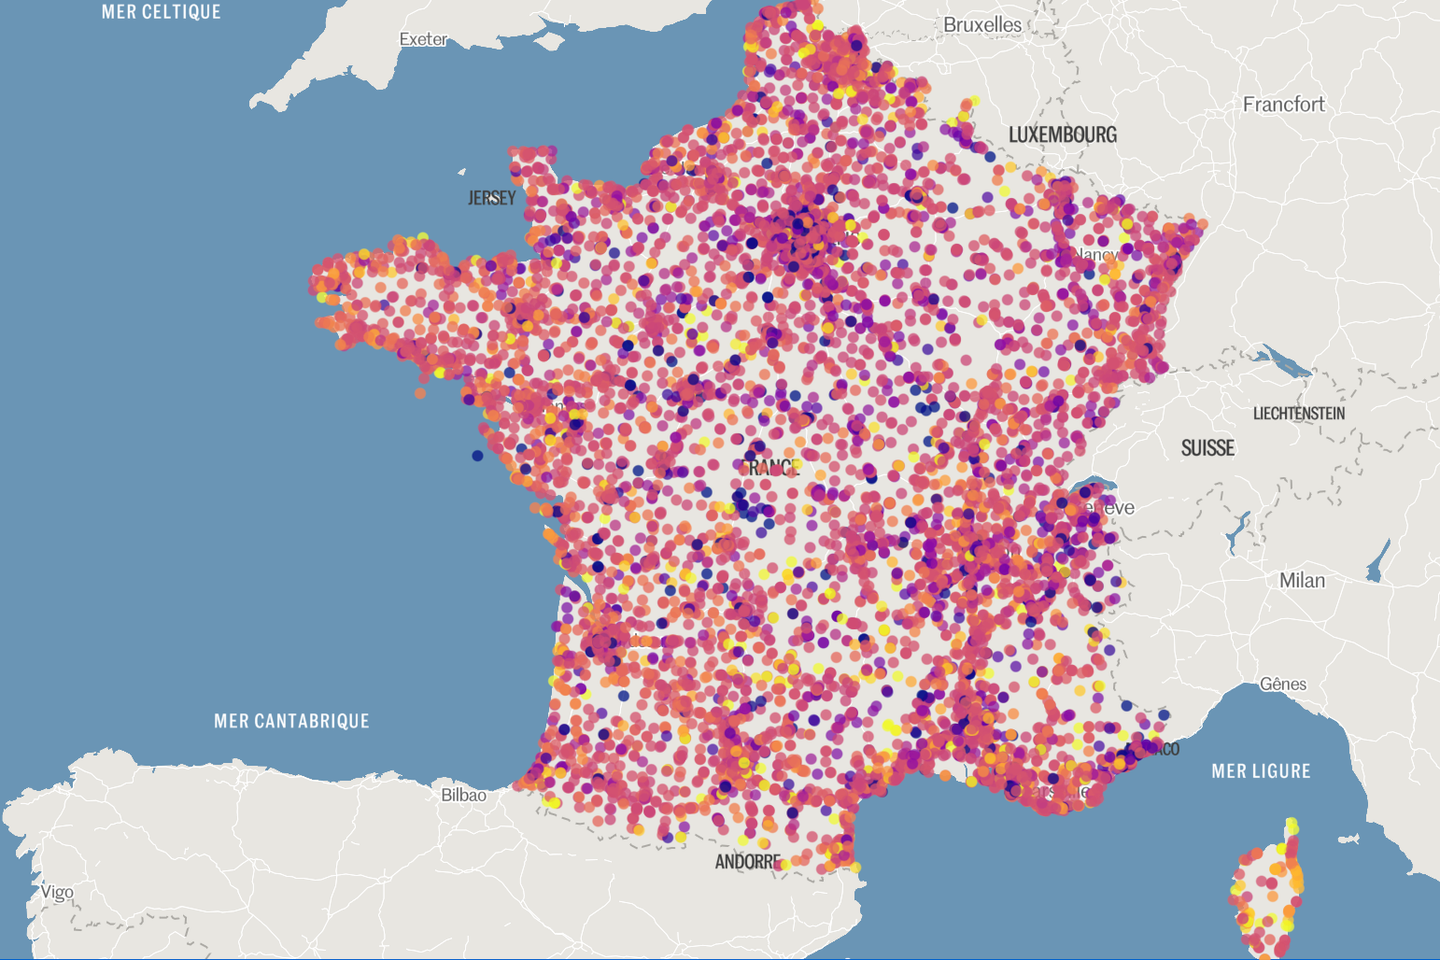
Les conséquences de la guerre au Moyen-Orient se font désormais sentir très clairement sur les prix des carburants dans les stations-service françaises. Le blocage du détroit d’Ormuz perturbe le trafic mondial de pétrole, provoquant une flambée du prix du baril, et donc, par ricochet, l’augmentation des prix payés à la pompe par les consommateurs. Voici une carte pour consulter les prix des différents carburants dans près de 10 000 stations-service françaises, en métropole et en Corse. Gazole SP95 SP98 GPL E85 E10 Protomaps © OpenStreetMap Répartition des stations-services selon le prix Prix moyen du gazole : . Prix le moins élevé : . Prix le plus élevé : . ${(isMobile ? `Utilisez deux doigts pour zoomer et un seul pour déplacer la carte.` : `Utilisez la molette de votre souris pour zoomer et le clic gauche pour déplacer la carte.`) + " Cliquez sur un point pour découvrir le prix de l'essence de cette station."} Source : data.gouv.fr. `; } let selectedCarburant = "Gazole"; const carburantString = { "Gazole": "gazole", "SP95": "SP95", "SP98": "SP98", "GPLc": "GPL-c", "E85": "E85", "E10": "E10", } function pointToComma(str) { return String(str).replace(/\./g, ","); } function formatDuration(date) { const now = new Date(); const diff = now - date; const diffInMinutes = Math.round(diff / 60000); if (diffInMinutes < 1) { return "moins d'une minute"; } else if (diffInMinutes < 60) { return `${diffInMinutes} minute${diffInMinutes > 1 ? "s" : ""}`; } else if (diffInMinutes < 1440) { const hours = Math.round(diffInMinutes / 60); return `${hours} heure${hours > 1 ? "s" : ""}`; } else if (diffInMinutes < 43200) { const days = Math.round(diffInMinutes / 1440); return `${days} jour${days > 1 ? "s" : ""}`; } else { const months = Math.round(diffInMinutes / 43200); return `${months} mois`; } } async function initMap() { const carburants = last_update; const correspondance = await d3.csv( "https://assets-decodeurs.lemonde.fr/sheets/do7ejUU8V-98xRlCzWZHrUGqf9vWcg_3736.csv", ); const quantiles = await d3.csv( "https://assets-decodeurs.lemonde.fr/sheets/do7ejUU8V-98xRlCzWZHrUGqf9vWcg_3815.csv", ); const scaleIft = d3.scaleThreshold( [0.25, 0.5, 1, 3, 5], [ "#f7f7f7", "#e7d4e8", "#c2a5cf", "#9970ab", "#762a83", "#40004b", ], ); const scaleSeuil = d3.scaleThreshold( [1, 2, 3, 4], ["#f2f0f7", "#cbc9e2", "#9e9ac8", "#756bb1", "#54278f"], ); const boundsMetropole = [ [-5.708196140596648, 41.159442862997096], [10.502321973141084, 52.10689424982629], ]; const boundsReunion = [ [55.07775392654938, -21.44419066387674], [55.964781099227224, -20.774491046214454], ]; const boundsGuyane = [ [-54.985916441461164, 1.860861476138673], [-51.12804741318951, 5.636713160986992], ]; const boundsAntilles = [ [-63, 13.64581], [-59, 17.3], ]; const boundsMayotte = [ [44.9, -13.1], [45.4, -12.5], ]; const boundsPolynesie = [ [-150.01993671781142, -18.031020108402718], [-149.03472792054333, -17.281704029832003], ]; let layerStationsServices; if (carburants) { hideSpinner(); let tooltip = d3.select(".carte_carburant__tooltip"); function fillTooltip({ x, y, object }) { tooltip.classed("tooltip--hidden", false); const stationsCarburants = { "Prix du Gazole": "Gazole", "Prix du SP95": "SP95", "Prix du SP98": "SP98", "Prix du GPL-c": "GPLc", "Prix du E85": "E85", "Prix du E10": "E10", }; const content = ` ${object.nom1 || "Station service " + object.adress} ${object.nom1 ? `${object.adress}` : ""} ${Object.entries(stationsCarburants) .filter( ([nomFormate, nomClef]) => object["prix_" + nomClef] && +object["prix_" + nomClef] > 0, ) .map( ([nomFormate, nomClef]) => `${nomFormate} : ${pointToComma(object["prix_" + nomClef])} € ${object["maj_" + nomClef] ? ` (données mis à jour il y a ${formatDuration(new Date(object["maj_" + nomClef]))} ${new Date(object["maj_" + nomClef]) < new Date(Date.now() - 7 * 24 * 60 * 60 * 1000) ? ", susceptibles d'avoir fortement évolué" : ""}) ` : ""} `, ) .join("")} `; // Fill tooltip tooltip .select(".tooltipcontent") .attr("aria-label", "Articles politiquess") .html(content); tooltip.select(".tooltipcross").on("click", onMouseOut); // Display and translate tooltip if (isMobile) { tooltip .classed("tooltip--hidden", false) .style("bottom", 0) .style("left", 0); } else { tooltip .classed("tooltip--hidden", false) .style("bottom", `${y}px`) .style("left", `${x}px`); } } // Hide tooltip function onMouseOut() { // document.querySelector('canvas').style.cursor = 'unset'; tooltip.classed("tooltip--hidden", true); } const mapSettings = { center: [4.7, 47], zoom: 4, minZoom: 1, maxZoom: 12, bearing: 0, pitch: 0, }; const themeUrl = isDark ? "https://assets-decodeurs.lemonde.fr/decodeurs/assets/protomaps/contrast_daltoniens_darkmode_fr_v0.0.5.json" : "https://assets-decodeurs.lemonde.fr/decodeurs/assets/protomaps/contrast_daltoniens_fr_v0.0.5.json"; const theme = await d3.json(themeUrl); const map = new maplibregl.Map({ container: "carte_carburant", style: { version: 8, glyphs: "https://assets-decodeurs.lemonde.fr/decodeurs/assets/protomaps_fonts/{fontstack}/{range}.pbf", sources: { protomaps: { type: "vector", maxzoom: 15, tiles: [ "https://prd-protomap.8084.lemonde.io/20240111/{z}/{x}/{y}.mvt", ], }, }, layers: theme, }, center: mapSettings.center, zoom: mapSettings.zoom, minZoom: mapSettings.minZoom, maxZoom: mapSettings.maxZoom, //pitch: mapSettings.pitch, //bearing: mapSettings.bearing, //maxBounds: mapSettings.bounds }); map.on("load", () => { render(); }); const deckOverlay = new deck.MapboxOverlay({ onClick: ({ x, y, object }) => { if (object == undefined) return onMouseOut(); const mapContainer = document.getElementById("carte_carburant"); const adjustedY = mapContainer.offsetHeight - y; return ( object && fillTooltip({ x, y: adjustedY, object }) ); }, onDragStart: () => onMouseOut(), onResize: () => onMouseOut(), pickingRadius: isMobile ? 20 : 8, interleaved: false, }); window.addEventListener("click", (event) => { if ( !event.target.closest(".carte_carburant__tooltip") && !event.target.closest("canvas") ) { onMouseOut(); } }); // Add deck layer map.addControl(deckOverlay); let scale = new maplibregl.ScaleControl({ maxWidth: 80, unit: "metric", }); map.addControl(scale); // Enable exploration map.boxZoom.disable(); map.keyboard.disable(); map.doubleClickZoom.disable(); map.touchZoomRotate.disable(); map.dragRotate.disable(); map.touchPitch.disable(); map.scrollZoom.enable(); map.boxZoom.enable(); map.touchZoomRotate.enable(); map.dragPan.enable(); map.fitBounds(boundsMetropole); // map.flyTo({ // center: mapSettings.center, // zoom: mapSettings.zoom + 0.2, // speed: 0.25, // curve: 0.2, // }); map.addControl( new maplibregl.NavigationControl({ showCompass: false }), "top-left", ); // Render layerspolys function render() { const filteredCarburants = carburants.filter( (d) => +d["prix_" + selectedCarburant] && +d["prix_" + selectedCarburant] > 0, ); if(selectedCarburant == "GPLc" ) { console.log(filteredCarburants);} const filteredCarburantRecent = selectedCarburant == "GPLc" ? filteredCarburants : filteredCarburants.filter( (d) => new Date(d["maj_" + selectedCarburant]) > new Date( Date.now() - 7 * 24 * 60 * 60 * 1000, ), ); const mean = d3.mean( filteredCarburantRecent, (d) => +d["prix_" + selectedCarburant], ); const std = d3.deviation( filteredCarburantRecent, (d) => +d["prix_" + selectedCarburant], ); const bornes = [ mean - 2 * std, mean - std, mean, mean + std, mean + 2 * std, ]; layerStationsServices = new deck.ScatterplotLayer({ id: "layerStationsServices", data: filteredCarburants, getPosition: (d) => { return [+d["long"], +d["lat"], 0]; }, getFillColor: (d) => { if ( new Date(d["maj_" + selectedCarburant]) < new Date(Date.now() - 7 * 24 * 60 * 60 * 1000) ) { return [150, 150, 150]; } const value = d3.interpolatePlasma( 1 - (+d["prix_" + selectedCarburant] - bornes[0]) / (bornes[4] - bornes[0]), ); const color = d3.color(value).rgb(); return [ Math.round(color.r), Math.round(color.g), Math.round(color.b), ]; }, getRadius: 500, radiusMinPixels: 3, radiusMaxPixels: 10, pickable: true, parameters: { depthTest: false, webgl2: false, }, }); deckOverlay.setProps({ layers: [layerStationsServices] }); const min = filteredCarburantRecent[ d3.minIndex( filteredCarburantRecent, (d) => +d["prix_" + selectedCarburant], ) ]; const max = filteredCarburantRecent[ d3.maxIndex( filteredCarburantRecent, (d) => +d["prix_" + selectedCarburant], ) ]; container.querySelector(".statistics").innerHTML = ` Prix moyen du ${carburantString[selectedCarburant]} : ${pointToComma(mean.toFixed(2))} €. Prix le plus bas : ${pointToComma(min["prix_" + selectedCarburant].toFixed(2))} € ${min["departement"] ? `(${min["departement"]})` : ""}. Prix le plus élevé : ${pointToComma(max["prix_" + selectedCarburant].toFixed(2))} € ${max["departement"] ? `(${max["departement"]})` : ""}. `; container.querySelectorAll(".flyto-price").forEach((el) => { el.onclick = () => { const long = el.getAttribute("data-long"); const lat = el.getAttribute("data-lat"); map.flyTo({ center: [long, lat], zoom: 10, }); }; }); // D3 LEGENDE : const legend = container.querySelector( ".lmui-chart__legend", ); // D3 Bar Chart de répartition - bloc de 0.1 (1e à 1.1e, 1.1e à 1.2e, etc) : const stationsPerPriceRange = Array.from(d3.group( filteredCarburantRecent, (d) => { if (d["prix_" + selectedCarburant] < bornes[0]) { return Math.floor(bornes[0] * 10) / 10; } else if (d["prix_" + selectedCarburant] > bornes[4]) { return Math.ceil(bornes[4] * 10) / 10; } else { return Math.floor(d["prix_" + selectedCarburant] * 10) / 10; } } )); const priceRange = stationsPerPriceRange.map(([priceRange, stations]) => ({ priceRange, nbStations: stations.length, })).sort((a, b) => a.priceRange - b.priceRange); const x = d3.scaleBand() .domain( priceRange.map((d) => d.priceRange) ) .range([0, d3.select(".chart-repartition-carburant svg").node().getBoundingClientRect().width]) .padding(0.1); const y = d3 .scaleSqrt() .domain([0, d3.max(priceRange.map(priceRange => priceRange.nbStations))]) .range([0, 80]); // d3.interpolatePlasma( // 1 - // (+d["prix_" + selectedCarburant] - // bornes[0]) / // (bornes[4] - bornes[0]), // ); d3.select(".chart-repartition-carburant svg g.rects") .selectAll("rect") .data(priceRange) .join("rect") .attr("x", (d, i) => x(x.domain()[i])) .attr("y", (d) => 105 - y(d.nbStations)) .attr("width", x.bandwidth()) .attr("height", (d) => y(d.nbStations)) .attr("fill", d => d3.interpolatePlasma(1 - ((d.priceRange + 0.05 - bornes[0]) / (bornes[4] - bornes[0])))); d3.select(".chart-repartition-carburant svg g.texts") .selectAll("text") .data(priceRange) .join("text") .attr("x", (d, i) => x(x.domain()[i]) + x.bandwidth() / 2) .attr("y", (d) => 100 - y(d.nbStations) - 5) .attr("text-anchor", "middle") .text((d) => d.nbStations.toLocaleString("fr-FR")) .attr("fill", "black") .attr("font-size", "12px"); d3.select(".chart-repartition-carburant svg g.legends") .selectAll("text") .data(priceRange) .join("text") .attr("x", (d, i) => x(x.domain()[i]) + x.bandwidth() / 2) .attr("y", 120) .attr("text-anchor", "middle") .attr("font-weight", 500) .text((d, i) => { if (isMobile) { if (i == 0) { return `< ${d.priceRange.toLocaleString("fr-FR", {maximumFractionDigits: 1})}€`; } else if (i == priceRange.length - 1) { return `> ${d.priceRange.toLocaleString("fr-FR", {maximumFractionDigits: 1})}€`; } else { return `${(d.priceRange + 0.05).toLocaleString("fr-FR", {maximumFractionDigits: 1})}€`; } } else { if (i == 0) { return ` ${d.priceRange.toLocaleString("fr-FR", {maximumFractionDigits: 1})}€ et moins`; } else if (i == priceRange.length - 1) { return `${d.priceRange.toLocaleString("fr-FR", {maximumFractionDigits: 1})}€ et plus`; } else { return `${d.priceRange.toLocaleString("fr-FR", {maximumFractionDigits: 1})} - ${(d.priceRange + 0.1).toLocaleString("fr-FR", {maximumFractionDigits: 1})}€`; } } }) .attr("fill", "black") .attr("font-size", "12px"); d3.select(".repartition-title").text(`Répartition des ${filteredCarburantRecent.length.toLocaleString("fr-FR")} stations-services selon le prix du ${carburantString[selectedCarburant]}`); } // Render first view map.onload = () => { render(); }; render(); // Watch flyto document .querySelectorAll(".carte_carburant__flytobtn") .forEach((btn) => { btn.onclick = () => { const place = btn.getAttribute("data-attr"); switch (place) { case "reset": map.fitBounds(boundsMetropole, { animate: false, }); break; case "reunion": map.fitBounds(boundsReunion, { center: [55.558823, -21.109403], animate: false, }); break; case "guyane": map.fitBounds(boundsGuyane, { center: [-53.14191, 4.113978], animate: false, }); break; case "antilles": map.fitBounds(boundsAntilles, { center: [-61.235294, 15.125274], animate: false, }); break; case "mayotte": map.fitBounds(boundsMayotte, { center: [45.150284, -12.800424], animate: false, }); break; case "polynesie": map.fitBounds(boundsPolynesie, { animate: false, }); break; default: map.fitBounds(boundsMetropole, { animate: false, }); break; } }; }); /* AUTOCOMPLETE*/ let max_n_to_display = 6; let min_char_to_search = 1; let format_to_search = slugify; let no_results_message = "Aucun résultat avec cette recherche"; const reset_func = () => {}; const func_to_treat_result_donnees = (result) => { map.flyTo({ center: [result["Longitude"], result["Latitude"]], zoom: 10, }); // if (isMobile) { // fillTooltip({ x: 0, y: 0, object: result }); // document.querySelector( // ".carte_carburant__container .tooltipcross", // ).onclick = () => { // onMouseOut(); // }; // } }; container .querySelector("#carburant-select") .addEventListener("change", (e) => { selectedCarburant = e.target.value; render(); }); const lastSearch = new Date(); async function autocomplete_communes_decodeurs( id_container, func_to_treat_result, func_to_reset, max_n_to_display = 5, no_results_message = "Aucun résultat avec cette recherche", ) { const get_search_value_in_data = (f) => { return f.properties.label; }; // OnSearch / OnResults const onSearch = async (currentValue) => { // Typical search if (currentValue.replaceAll(/\s/g, "").length < 3) return; const q = currentValue.replaceAll(/\s/g, "+"); const api_communes = `https://data.geopf.fr/geocodage/search/?q=${q}&type=municipality&limit=${max_n_to_display}`; const data = await fetch(api_communes); const rep = await data.json(); const data_communes = rep.features; return data_communes; }; await _generic_autocomplete( id_container, get_search_value_in_data, onSearch, func_to_treat_result, func_to_reset, 3, no_results_message, ); } autocomplete_communes_decodeurs( // L'id du lmui-search "prix-essence-search", //Une fonction qui s'execute quand on sélectionne un item (result) => { map.flyTo({ center: result.geometry.coordinates, zoom: 10, }); }, // Une fonction qui s'execute quand on désélectionne / reset reset_func, // Nombre de choix dans le autocomplete, par défaut 5 max_n_to_display, // Nombre de lettres avant le déclenchement de l'autocomplete, par défaut 3 min_char_to_search, // Une fonction qui normalise les input pour la recherche, par défaut slugify, // c'est à dire que la casse et les accents sont ignorés format_to_search, // Texte à afficher si aucun resultat, par défaut "Aucun résultat avec cette recherche" no_results_message, ); } } // const INIT_DELAY = 2000; // 2 secondes document.addEventListener("DOMContentLoaded", () => { fillHtml(); // d3.select(".lmui-chart__legend") // .append("svg") // .attr("width", 300) // .attr("height", 50); let chart = d3.select(".chart-repartition-carburant") .append("svg") .attr("width", "100%") .attr("height", 125) chart.append("g").attr("class", "rects"); chart.append("g").attr("class", "texts"); chart.append("g").attr("class", "legends"); initMap(); // setTimeout(() => { // initMap(); // }, INIT_DELAY); }); window.onresize = () => { isMobile = window.innerWidth { console.error(event); alert("bug"); }); Valentin Regnault S’abonner
🔗 Lire l'article original
👁️ 5 lectures